Brand Monitoring in 2026: B2B Brands Built in Public
How to track meaningful brand signals, avoid alert fatigue, and respond in time.
Over the last few years, B2B businesses — especially in technology — have undergone a quiet but fundamental shift.
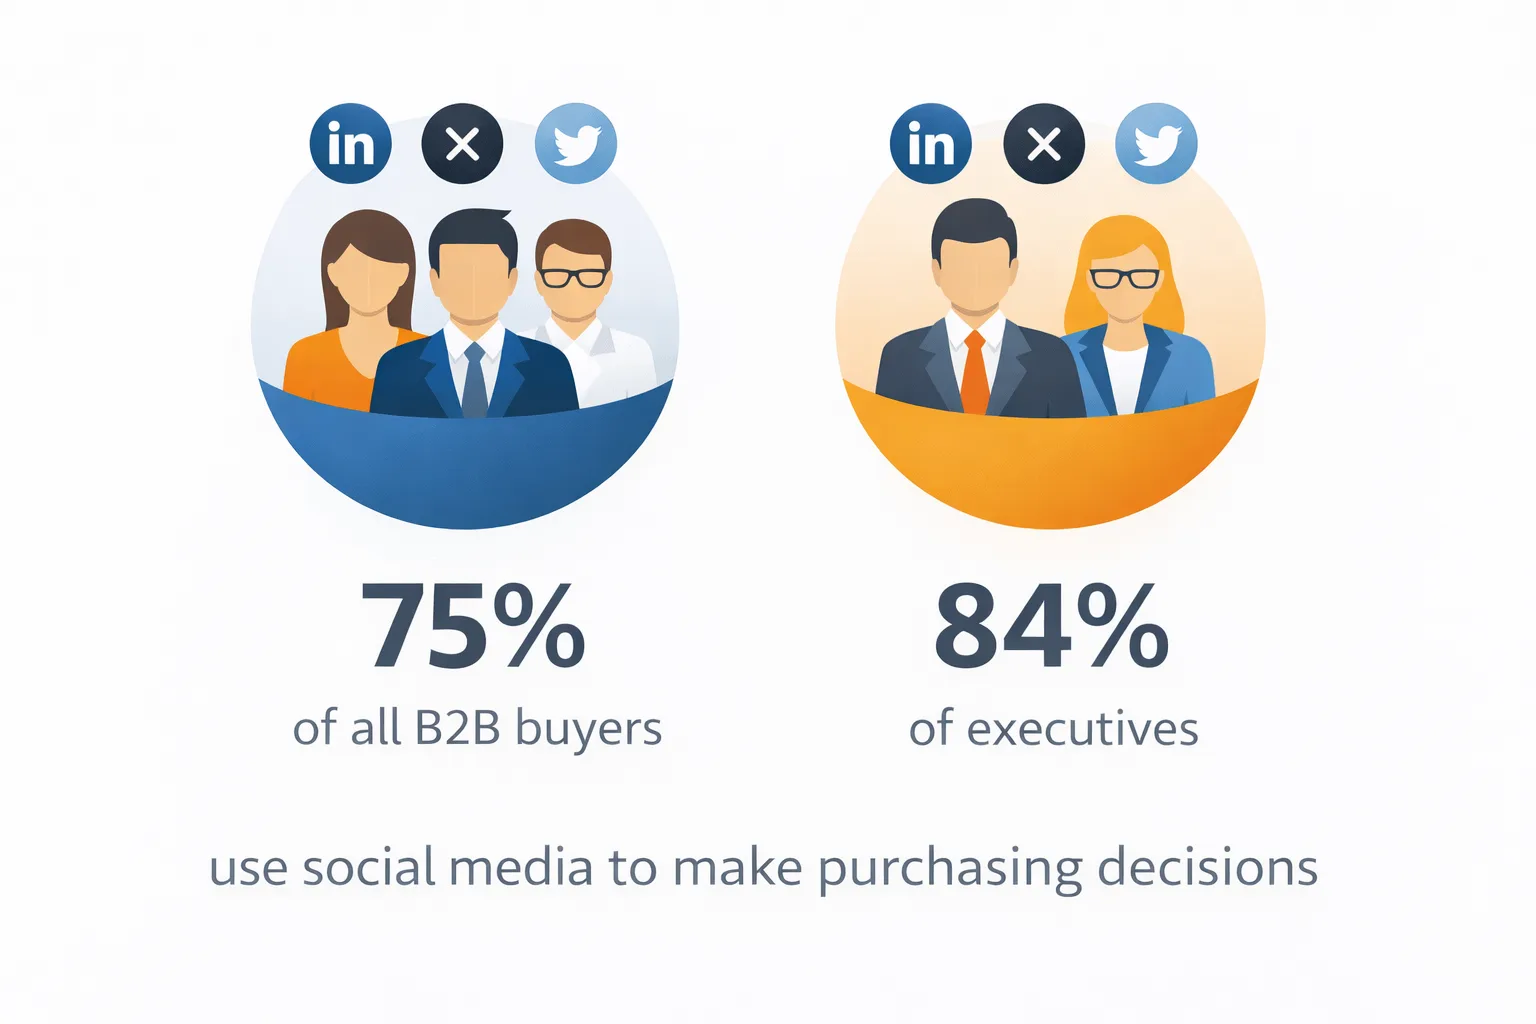
Developer tools, infrastructure products, and AI software are now evaluated in much the same way as consumer products. What used to be shaped by analyst reports and gated research is increasingly decided in public: in threads on X, discussions on Reddit, or comment chains on Hacker News. 75% of all B2B buyers and 84% of executives use social media to make purchasing decisions [ ICP ].
As a result, what people say about your brand online often carries more weight than what you publish on your website, your social channels, or a carefully crafted white paper.
Reputation is no longer shaped episodically through campaigns or announcements, but continuously — in conversations teams don’t control.
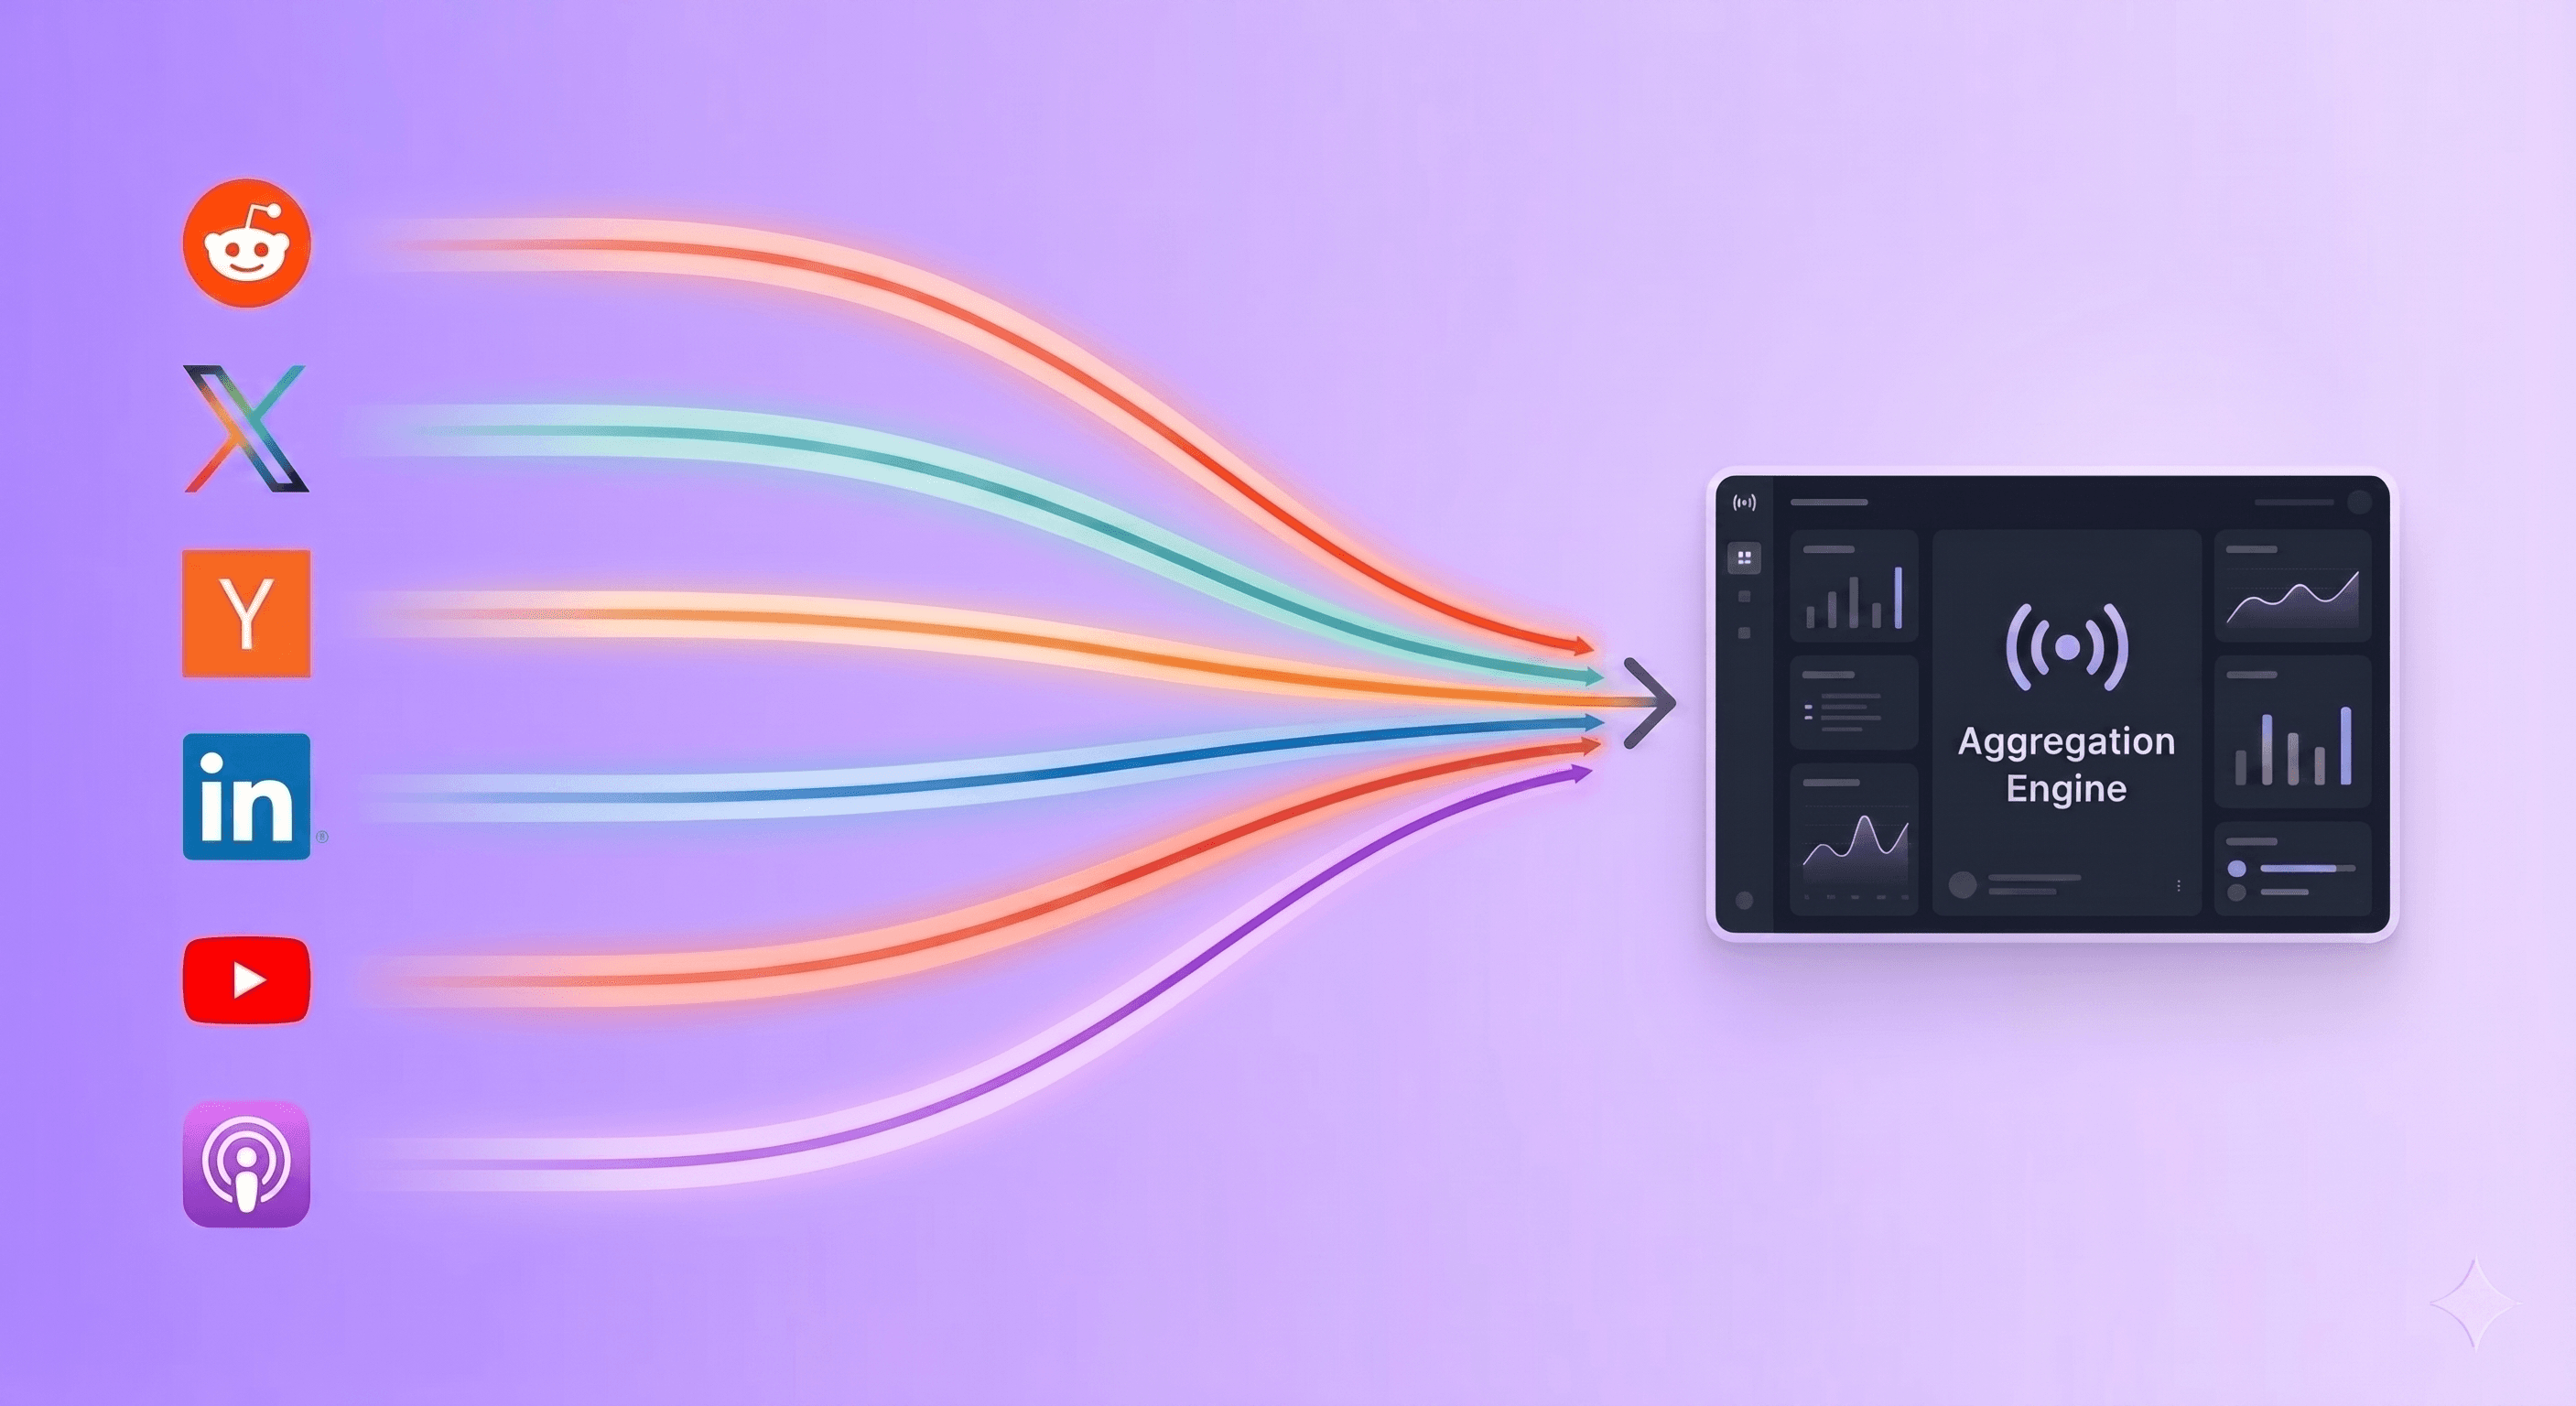
That shift is where brand monitoring starts to matter — and where most setups begin to fail. Monitoring social channels works when volume is low and teams can still read everything that comes in.
As soon as a brand crosses a certain threshold and starts receiving thousands of mentions each month, that model breaks down. Activity increases, but clarity disappears.
Alerts flood inboxes and Slack channels, yet no one knows what actually requires action.
Ownership blurs: product, marketing, and support all assume someone else is handling it.
Alert fatigue sets in quickly, channels get muted “temporarily,” and important signals slip by unnoticed. Critical moments aren’t missed because mentions weren’t visible, but because they weren’t interpretable.
By the time teams realize something matters, the conversation has already moved on — and with it their connection to what customers actually want.
Brand monitoring is not about awareness, it’s about action. Its purpose isn’t to count how often your brand is mentioned, but to detect meaningful signals as they happen. A brand mention only matters when it appears in context: inside a complaint, a comparison, a moment of confusion, or an active buying decision.
Outside of those situations, most mentions are just background noise. That’s why brand monitoring only earns its place when it enables concrete workflows (i.e. escalation, response, clarification) rather than producing reports and dashboards.
When it works, alerts don’t feel constant or overwhelming.
They feel rare, obvious, and hard to ignore, precisely because they point to moments that actually require action from your team.
Most traditional brand monitoring and social listening tools fail at scale not because they miss data, but because they were designed for visibility, not decision-making. The same pattern holds across the social media monitoring tools we've compared: most are great at collecting and bad at deciding.
Their core model assumes that capturing everything and surfacing it in dashboards is sufficient.
At a small scale, that feels useful.
At a meaningful scale, it becomes counterproductive. These tools treat all mentions as roughly equivalent events.
As a result, they struggle to distinguish between a passing reference and a moment that requires intervention.
Context is flattened, conversations are fragmented, and teams are left to reconstruct meaning manually (if they have time at all).
Traditional tools are optimized for analysts and reports, not for teams that need to respond in real time.
Signals arrive without clear routing, priority, or responsibility attached.
Monitoring becomes observational rather than operational, producing insights that look valuable but arrive too late to change outcomes.
Finally, most platforms optimize for retrospective analysis.
They are good at telling you what happened last week or last month, but poorly suited for identifying what just changed.
By the time trends show up clearly in charts, the opportunity to respond early has already passed. For brands that are scaling, these design choices compound.
The problem isn’t that teams lack tools - it’s that the tools were never built to support fast, contextual decisions when reputation is being shaped in real time.
Brand monitoring in 2026 starts with a different assumption: **not everything needs to be seen, only what is likely to change an outcome. ** Instead of treating mentions as isolated events, modern monitoring looks for patterns forming across time, context, and sources.
This is where AI meaningfully helps - not by replacing judgment, but by reducing the surface area teams have to pay attention to.
AI can cluster related conversations, surface recurring themes, and flag shifts that would be impossible to spot manually at scale.
 What it cannot do is decide what matters for your business or how to respond.
That responsibility still sits with humans.
When AI is used correctly, it acts as a filter and amplifier for signals, making important moments easier to recognize and harder to ignore - not by producing more alerts, but by narrowing attention to the few changes that actually require action.
Brand monitoring only works when it is embedded directly into your team’s existing workflows.
In practice, effective brand monitoring consistently enables a small set of repeatable actions rather than generic awareness. Based on our experience, these are the five workflows where brand monitoring delivers the most value:
- Misinformation correction when inaccurate assumptions or outdated claims start to spread
- Product feedback escalation when recurring issues or confusion signal a real gap
- Competitive comparison response when buyers actively weigh alternatives in public conversations
- Churn risk detection by surfacing public frustration before it reaches support or account management
- Sales objection awareness so teams aren’t surprised by concerns prospects have already discussed publicly
For these workflows to function, alerts need clear ownership: who looks, who decides, and who acts.
Different signals belong to different teams, whether that’s product, marketing, sales, or support. Monitoring only works when it triggers explicit next steps instead of passive awareness.
Alerts should enter the workflow once, not bounce endlessly between teams.
Cadence matters more than constant attention, because the goal of brand monitoring is fast alignment and response. When it works, monitoring reduces surprises instead of creating more meetings.